To analyze the relevance of the company's products, based on their position in the market in relation to the growth of the market for these products and the market share occupied by the company selected for analysis.
This tool is theoretically justified. It is based on two concepts: the life cycle of a product and the economies of scale of production or the learning curve.
The axes of the matrix show market growth (vertical axis) and market share (horizontal axis). The combination of estimates of these two indicators makes it possible to classify the product, highlighting four possible roles of the product for the company that produces or sells it.
Classifications of types of strategic business units
"Stars"
High sales growth and high market share. Market share must be maintained and increased. "Stars" bring a very large income. But, despite the attractiveness of this product, its net cash flow is quite low, as it requires significant investment to ensure a high growth rate.
"Cash Cows" ("Money Bags")
High market share but low sales volume growth. "Cash cows" must be protected and controlled as much as possible. Their attractiveness is explained by the fact that they do not require additional investments and at the same time provide a good cash income. Proceeds from sales can be directed to the development of "Difficult Children" and to support the "Stars".
"Dogs" ("Lame Ducks", "Dead Weight")
Growth rate is low, market share is low, product generally low level profitability and requires great attention from the manager. Get rid of dogs.
"Difficult Children" ("Wild Cats", "Dark Horses", "Question Marks")
Low market share, but high growth rates. Difficult children need to be studied. In the future, they can become both stars and dogs. If there is a possibility of transfer to the stars, then you need to invest, otherwise, get rid of it.
Flaws
- Strong simplification of the situation;
- The model takes into account only two factors, but high relative market share is not the only success factor, and high growth rates are not the only indicator of market attractiveness;
- Lack of consideration of the financial aspect, the removal of dogs can lead to an increase in the cost of cows and stars, as well as negatively affect the loyalty of customers using this product;
- The assumption that market share corresponds to profit, this rule may be violated when a new product is introduced to the market with large investment costs;
- The assumption that the market decline is caused by the end of the product's life cycle. There are other situations in the market, for example, the end of the rush demand or the economic crisis.
Advantages
- theoretical study of the relationship between financial receipts and the analyzed parameters;
- objectivity of the analyzed parameters (relative market share and market growth rate);
- clarity of the results obtained and ease of construction;
- it allows you to combine portfolio analysis with a product life cycle model;
- simple and easy to understand;
- it is easy to develop a strategy for business units and an investment policy.
Construction rules
The horizontal axis corresponds to the relative market share, coordinate space from 0 to 1 in the middle with a step of 0.1 and further from 1 to 10 with a step of 1. Market share estimation is the result of the analysis of sales of all industry participants. Relative market share is calculated as the ratio of own sales to sales of the strongest competitor or the top three competitors, depending on the degree of concentration in a particular market. 1 means that own sales are equal to sales of the strongest competitor.
The vertical axis corresponds to the growth rate of the market. The coordinate space is determined by the growth rates of all company products from maximum to minimum, the minimum value can be negative if the growth rate is negative.
For each product, the intersection of the vertical and horizontal axes is set and a circle is drawn, the area of \u200b\u200bwhich corresponds to the share of the product in the company's sales.
Links
- Practical methods for developing and analyzing the company's product strategy based on internal secondary information
Notes
Wikimedia Foundation. 2010 .
See what the "BCG Matrix" is in other dictionaries:
GROWTH-MARKET SHARE MATRIX, or BCG matrix- one of the most common, classic tools of marketing analysis, and in particular portfolio analysis of company strategies. The matrix gained fame and name thanks to the work of the Boston Consulting Group (BCG, or, in Russian, Boston ... ...
BCG MATRIX (BOSTON ADVISORY GROUP)- a two-dimensional matrix with which you can identify winners (market leaders) and establish the degree of balance between enterprises in the context of the four quadrants of the matrix: enterprises that have won large market shares in growing sectors ... ... Big Economic Dictionary
BCG matrix(English Boston Consult Group, BCG) a tool for strategic analysis and planning in marketing. Created by the founder of the Boston Consulting Group, Bruce D. Hendersen, to analyze the position of the company's products on the market ... ... Wikipedia
- (matrix product market) analytical tool strategic management, developed by the founder of this science, an American of Russian origin, Igor Ansoff, and designed to determine the product positioning strategy ... ... Wikipedia
PORTFOLIO ANALYSIS- [English] portfolio analysis] in marketing, the analysis of product types (activities or types of projects) using the classification of all commodity markets firms according to two independent measurement criteria: market attractiveness and ... ... Marketing. Big explanatory dictionary
Bruce D. Hendersen Bruce D. Henderson Occupation: Entrepreneur, author of the BCG Matrix, founder of the Boston Consulting Group Date of birth: 1915 (1915) ... Wikipedia
Hendersen, Bruce D Bruce D. Henderson Bruce D. Henderson Occupation: Entrepreneur, author of the BCG Matrix, founder of the Boston Consulting Group Date of birth: 1915 ... Wikipedia
The BCG matrix, also called "growth - market share", is a simple and visual tool for portfolio analysis. Accessibility, originality of the names of the chart sectors made it very popular among marketers and managers. Consider the example of building a matrix in Excel.
Application examples of the BCG matrix
Using the Boston Consulting Group (BCG) matrix, you can quickly and visually analyze product groups, branches of an enterprise or company based on their share in the relevant market segment and market growth rate. The application of the tool is based on two hypotheses:
- The market leader has a competitive advantage in production costs. Therefore, the leading company has the highest profitability in the segment.
- To work effectively in a fast-growing market, an enterprise needs to invest a lot in the development of its product. Presence in a segment with a low growth rate allows the company to reduce this cost item.
Using the BCG matrix, you can quickly identify the most promising and the most “weak” products (branches, companies). And already on the basis of the data received, make a decision: which assortment group (subdivision) to develop, and which one to liquidate.
All the analyzed elements, after the work done on the analysis, fall into one of four quadrants:
- "Problems". Products present in high-growth industries but with low market share. Significant financial investments are needed to strengthen their position in the market. When an assortment group or division falls into this quadrant, the enterprise decides whether it has sufficient funds for the development of this direction. Without cash injections, the product does not develop.
- "Stars". Lines of business and products are leaders in a rapidly growing market. The task of the enterprise is to support and strengthen these products. The best resources should be allocated to them, because it is a stable source of income.
- "Money Bags" Products with a relatively high market share in a slow growing segment. They do not need high investments and are the main generator of funds. The proceeds from their sale should go to the development of "stars" or "wild cats".
- "Dead weight". Feature– relatively low market share in a slowly growing segment. These directions do not make sense to develop.
BCG matrix: an example of construction and analysis in Excel
Consider the construction of the BCG matrix on the example of an enterprise. Preparation:


Construction of the BCG matrix
In Excel, a bubble chart is best suited for this purpose.

Through the "Insert" add a construction area to the sheet. Enter the data for each row as follows:

On the horizontal axis - the relative market share (we set up a logarithmic scale: "Layout" - "Format of the horizontal axis"). On the vertical - the rate of market growth. The chart area is divided into 4 identical quadrants:
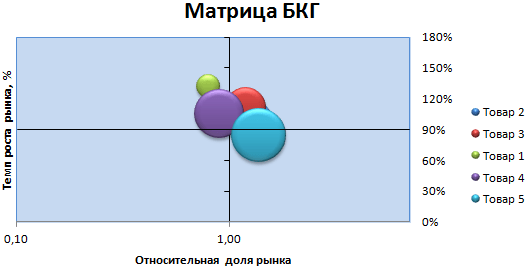
The central value for the market growth rate is 90%. For relative market share - 1.00. Based on these data, we will distribute the product categories:

Conclusions:
- "Problems" - Goods 1 and 4. Investments are needed for the development of these items. Development scheme: creation competitive advantage- distribution - support.
- "Stars" - Goods 2 and 3. The company has such categories - and this is a plus. At this stage, only support is needed.
- "Cash Cows" - Good 5. Brings in a good profit that can be used to finance other products.
- "Dead weight" was not found.
Growth-Market Share Matrix, or BCG Matrix- one of the most common, classic tools, and in particular portfolio analysis of company strategies. The matrix gained fame and name thanks to the work of the Boston Consulting Group (BCG, or, in Russian, the Boston advisory group, BKG) and the founder of this group, B. Henderson.
In the 1970s in the BCG was developed original way classification of products, which helped to optimize cash flows by position, the place that a product or service occupies in the matrix field. The BCG matrix allows you to classify goods or services produced by an enterprise (organization), depending on or depending on the dynamics of consumer preferences for a particular product. Thus, the model directly reflects the preferences of consumers regarding a particular product.
The BCG matrix uses two criteria to classify a company's current and potential product strategies:
- rates of growth target segment market as a characteristic of its attractiveness;
- market share relative to the most dangerous (largest) competitor as a characteristic of competitiveness.
For each criterion, the score is determined by the binary system: high/low market growth rates and large/small relative market share. The result is a matrix with four quadrants, almost each of which has received a number of names (see figure).
In this matrix, the median horizontal line along the "Market Growth Rate" axis separating "stars" and " wild cats» from «milk cows» and «dogs», corresponds to the average growth rate of the gross product in the market under consideration, weighted average the growth rate of the various segments in which the firm operates, or another measure of the comparative attractiveness of market segments.
The median vertical line running along the “Relative market share” axis and separating “stars” and “cash cows” from “wild cats” and “dogs” corresponds to one in the ratio between the market share of this firm and the share of the leading competitor in a particular market segment by specific product.
In other cases, the absolute values of these indicators are also used.
It is possible to use a logarithmic scale for the market share indicator. Relativity means dividing the scores for specific products by their highest values for their own products or those of competitors. Thus, the range of change in relative indicators lies in the range from 0 to 1. For the indicator of market share in this case the reverse scale is used, i.e. in the matrix it ranges from 1 to 0, although in some cases a straight scale may also be used. The growth rate of the market is determined for some time interval, say, for a year.
There is also a modified version of the matrix, in which each of the estimates has three possible values: below the market average, at the level of the average and above the market average. The number of quadrants is thus increased to nine (3 x 3). Usually, when using the BCG matrix, the third indicator is used, the value of which determines the radius of the circle drawn around the point characterizing the position of the product in the matrix, or the area of the circle. In most cases, or is used as such an indicator, the participation of goods in coverage and profit.
The BCG matrix is built both for individual markets and for the total market. In addition to the level of individual products, it is applied at the level of strategic economic units (SHU) and the organization as a whole.
The BCG matrix is based on two basic hypotheses, assumptions:
- The larger the market share, the stronger the position of the organization in the competition. A significant market share reflects cost savings due to , while a small share reflects increased costs. It follows that the largest competitor has the highest and most favorable financial flows.
- The faster the growth rate, the greater the development opportunities. Presence in growing markets means an increased need for, and in low-growing markets - a correspondingly small need for them.
It is easy to see that the four quadrants reflect different stages of the product life cycle and each requires special strategic decisions that involve special competitive strategies, the combination of which makes up one or another portfolio strategy.
If the products are characterized by high values of both indicators, then they are called "stars" they should be supported and strengthened. True, the “stars” have one drawback: since the market is developing at a high pace, the “stars” require high prices, thus “eating up” the money they have earned.
If the products are characterized high value indicator X and low Y, they are called "milk cows" and are the generators of the organization's cash, since it is not required to invest in product and market development (the market does not grow or grows slightly), but there is no future behind them.
When X is low and Y is high, products are called "wild cats" ("difficult children"), they must be specially studied in order to establish whether they can not turn into "stars" with certain investments.
When both indicators, X and Y, have low values, then the products are called "losers" ("dogs", "dogs") bringing either small profits or losses. Get rid of them as much as possible, if not. good reasons to preserve them (possible resumption of demand, social significance product, etc.).
Successful products tend to start out as wildcats in the marketplace, then become stars, become cash cows as demand fills up, and end their market life as dogs. More specifically, it looks like this.
"Cash cows" ("slow growth/high share"): goods that can, in principle, provide more money than required to maintain their market share. For one reason or another, most often related to the maturity and saturation of the market, the growth rate of the market and sales of this product in this quadrant can be zero. The main role of "cows": they are a source of funds for the development of diversification or research, to support other categories of goods from other quadrants. The priority strategic goal is "harvesting".
"Dogs" ("slow growth/low share"): the most unpleasant position in the market. They are usually at a cost disadvantage and therefore have little hope of gaining market share, especially since the market struggle is largely over. Sometimes such products are saved out of stubbornness, in the fruitless hope of miraculously turning back into a "kidney", sometimes to fill a niche so as not to tempt competitors. A priority strategy is, in any case, a modest existence.
Wild Cats (fast growth/low share): This group of products requires significant funds to sustain growth. This most "troublesome" part of the nomenclature includes goods, the share of which is relatively low, but the growth rates are high. Although they are in a less advantageous position than the leader, they have a chance of success as the market expands. “Question marks” cannot stay in their quadrant for a long time. If these products are not financially supported to move into the “star” category, they will evolve to “dogs” as the nature of market dynamics changes to less attractive values, so there is an alternative: increase market share or deinvest.
"Stars" ("fast growth/high share"): leading products in a fast-growing market. They also require significant funds to maintain growth. However, due to their competitiveness, they are able to provide significant profits; as the market matures, they replace previous cash cows. If you do not invest enough money in strengthening and protecting these positions, the "star" can quickly turn not only into a "cow", but also into a "dog".
The scale of the business in this matrix can be indicated by a circle with a surface area proportional to sales or revenue, and even more correctly, proportional to the share of covering fixed costs and profits, since any product must cover variable costs a priori.
The analysis should be carried out in a dynamic mode, tracing the development of each business over time. The nature of development can be reflected by a vector directed towards one or another quadrant of the matrix, as well as a dotted image of a circle with a new diameter (reflecting the future profitability of the product).
One of the main achievements of the BCG matrix was that it established a strong link between strategic positioning and financial performance. But it also has its limitations:
- the applicability of the matrix is limited to industries with mass production, where the effect of economies of scale is convex;
- the matrix most often does not reflect the so-called external competitive advantages obtained with a successful choice of the segment and adequate product differentiation;
- a strictly analytical approach to the application of the matrix requires a lot of data, incl. about competitors, both in the past and in the future tense (the latter is especially difficult);
- the conclusions drawn from the matrix often remain general and vague.
It should be noted that the BCG matrix gives a static picture of the position of SCHEs, types of business in the market, on the basis of which it is impossible to make predictive assessments such as: “Where will the products under study be located in the matrix in a year?” This shortcoming can be compensated by carrying out repeated measurements at certain time intervals and fixing the directions of movement along the field of the matrix of individual products. Such information already has a certain predictive value.
Among the fundamental shortcomings of the BCG matrix is the inability to take into account interdependence () certain types business. If such a dependence exists, this matrix gives distorted results.
It should be noted that assessing the attractiveness of the market only in terms of the rate of change in sales volume, and the strength of the business position only in terms of market share, is a strong simplification. For each area, a multi-criteria assessment should be carried out, which is done when using the company matrix.
Wide application in practice strategic choice received a two-dimensional matrix developed by the Boston Advisory Group. Therefore, this matrix is better known as the Boston Consulting Group matrix, or the BCG matrix. This matrix allows a business to categorize products by their market share relative to major competitors and annual growth rates in the industry.
The matrix makes it possible to determine which product of the enterprise occupies a leading position compared to competitors, what is the dynamics of its markets, and allows for a preliminary distribution of strategic financial resources between products. The matrix is built on a well-known premise - the greater the share of the product on the market (the greater the volume of production), the lower the unit costs per unit of output and the higher the profit as a result of relative economies of production volumes.
The BCG matrix is compiled for the entire portfolio, and for each product the following information should be available:
The volume of sales in value terms, it is presented on the matrix of the area of the circle;
Product market share relative to the largest competitor, which determines the horizontal position of the circle in the matrix;
The growth rate of the market in which the enterprise operates with its products determines the vertical component of the circle in the matrix.
From the BCG matrices, if they are performed for different periods of time, it is possible to build a kind of dynamic series that will give (a visual representation of the patterns of movement in the market of each product, the directions and rates of promotion of goods on the market. When constructing the BCG matrix, the growth rate of sales of goods is divided into "high" and "low" by a conditional line at the level of 10%. The relative market share is also divided into "high" and "low", and the border between them is 1.0. A coefficient of 1.0 indicates that the company is close to leadership.
The interpretation of the BCG matrix is based on the following provisions:
First, the gross profit and total revenues of the enterprise increase in proportion to the growth of the market share of the enterprise;
Secondly, if an enterprise wants to maintain market share, then the need for additional funds grows in proportion to the growth rate of the market;
Third, since the growth of each market eventually declines as soon as the product approaches in its life cycle to the stage of maturity, therefore, in order not to lose the positions won earlier in the market, the profits received should be directed or distributed among products that have growth trends.
Based on the foregoing, the matrix suggests the following classification of product types in the respective strategic areas, depending on the characteristics of profit distribution: "stars", "cash cows", "wild cats" (or "question mark"), "dogs". This classification is shown in fig. 6.2.
"Stars" are products that occupy a leading position in a rapidly developing industry. They generate significant profits, but at the same time require significant amounts of resources to finance continued growth, as well as tight management control over these resources. In other words, they should be protected and strengthened in order to maintain rapid growth.
Rice. 6.2. BCG matrix
Cash cows are products that lead a relatively stable or declining industry. Since sales are relatively stable at no additional cost, this product generates more profit than is required to maintain its market share. Thus, the production of this type of product is a kind of cash generator for the entire enterprise, that is, to provide financial support for developing products.
“Dogs” are limited-sell products in an established or declining industry. Behind long time these products failed to win the sympathy of consumers on the market, and they are significantly inferior to competitors in all respects (market share, size and structure of costs, product image, etc.), in other words, they do not produce and do not need significant amounts of financial funds. An organization with such products may try to temporarily increase profits by penetrating special markets and reducing the provision of services, or withdraw from the market.
Problem Children (Question Mark, Wild Cats) are products that have little market impact (low market share) in an emerging industry. As a rule, they are characterized by weak customer support and unclear competitive advantages. Competitors dominate the market. Since low market share usually means small profit and limited income, these products, being in high-growth markets, require large funds to maintain market share and, of course, even more funds to further increase this share.
On fig. 6.2, the dashed line shows that "wild cats" under certain conditions can become "stars", and "stars" with the advent of inevitable maturity will first turn into "cash cows" and then into "dogs". The solid line shows the reallocation of resources from cash cows.
Thus, within the framework of the BCG matrix, the following options can be distinguished for the choice of strategies:
- growth and increase in market share- the transformation of the "question mark" into a "star";
- maintaining market share- a strategy for "cash cows", whose income is important for growing types of products and financial innovations;
- "harvesting", i.e. getting a short-term profit share as much as possible, even at the expense of market share- a strategy for weak "cows", deprived of the future, unfortunate "question marks" and "dogs";
- business liquidation or abandonment and using the resulting funds in other industries is a strategy for "dogs" and "question marks" who have no more opportunities to invest to improve their positions.
The BCG matrix can be used:
To determine interrelated conclusions about the position of the products (or business units) that make up the enterprise and their strategic prospects;
For negotiations between top managers and managers at the business unit level and making decisions about the amount of investment (capital investment) in a particular business unit.
For example, "question marks" operating in fast-growing industries, as a rule, urgently need a constant inflow of funds to expand their business and strengthen their positions, and "money bags" with limited growth opportunities often have a cash surplus. In other words, using the BCG matrix, an enterprise forms the composition of its portfolio (that is, it determines the combination of capital investments in various industries, various business units).
One of the main tasks to be solved during strategic planning, - formation of an optimal commodity portfolio. For portfolio analysis, matrix and economic-mathematical methods can be used. These methods appeal to various sources of enterprise competitiveness in the market, use various optimality criteria, are based on their own system of analyzed parameters and have their own form of presenting results. Because of this, these methods have both their advantages and limitations on the interpretation of the results obtained. Without claiming to be exhaustive, let's consider the main methods of portfolio analysis used.
Matrix Methods
Matrix methods are the most popular due to their clarity and, unlike economic and mathematical methods, do not require special knowledge. As analyzed indicators, matrix methods in different form use two main aggregative parameters: the attractiveness of the market and competitive positions on it.
Within the framework of this book, we will confine ourselves to considering the two most popular matrix methods: the matrix of the Boston Consulting Group * 161 and the attractiveness-competitiveness matrix, developed by the McKee consulting company and first used to analyze the product portfolio of General Electric. Due to the latter, it is often called the McKinsey *162 or General Electric matrix in literary sources. These matrix methods are based on different assumptions.
*161: (Boston Consulting Group)
*162: (McKinsey)
Boston Consulting Group Matrix
The matrix of the Boston Consulting Group (BCG), developed in 1972, is also called the "growth-market share matrix" (Fig. 2.102). It uses two parameters: the growth rate of the target segment as an indicator of attractiveness, and the market share relative to the most dangerous competitor as an indicator of the company's competitiveness *163.
*163: (For example, if brand A owns 30% of the market, and the largest competitor (brand B) has a 50% share, brand A will have a relative share of 60%.)
Rice. 2.102.
The BCG matrix is based on the following basic assumptions: Scale effect. The presence of a company with a larger market share relative to the leading competitor means that it has a competitive advantage in terms of costs, and vice versa. From this premise it follows that the largest competitor will have the highest profitability when selling goods at average market prices (dominate in terms of costs) and its financial income will be maximum.